Category: Infographics

b2b ecommerce

B2B eCommerce Trends and Statistics

Commercial activities made by business with other business via electronic commerce platform stands for B2B eCommerce. Considering the statistics, it is forecasted that the Global B2B ecommerce industry will top around $6.7 trillion by 2020. This determines the scope and trends in B2B segments now-a-days.

Considerable amount of businesses are using this platform and many more to join the pace because the benefits is provide is highly recognizable.

Benefits of B2B eCommerce Platform:

  • Functionality for self-service
  • High level of scalability
  • Custom pricing
  • Custom quote
  • Flexible payment options
  • Ease in reordering
  • Mobile commerce
  • Omni-channel support
  • PCI security

All these have force businesses to match with the trend in order to boost the sales.

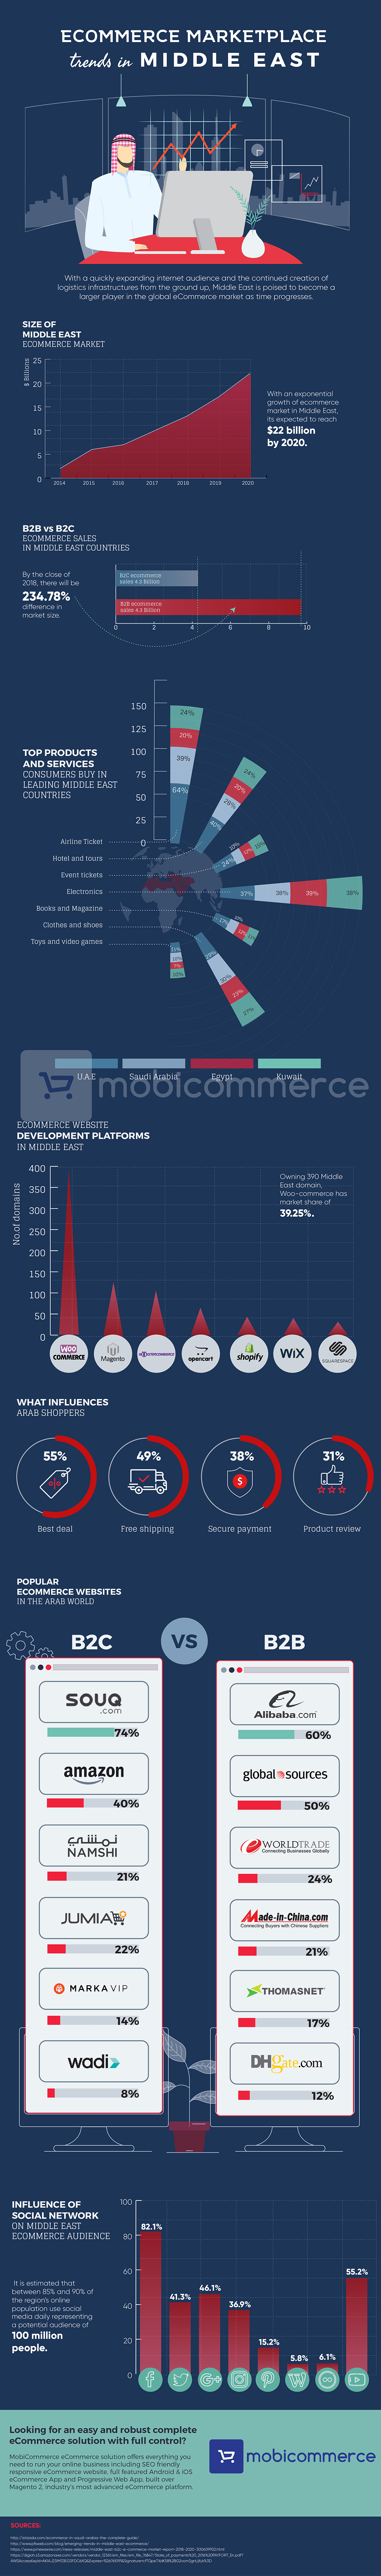
Surprising fact about B2B ecommerce is that though recently arises and less popular, it is double the size of B2C e-commerce. There are various advance platforms over which you can build your B2B e-commerce multi-channel systems.

In this Infographic, you’ll learn about trends and statistics of B2B Ecommerce industry and software solution which includes the importance of this platform, why it is in trends, countries having high demand of this platform, B2B sector industrial trends, platforms used to build the platform and lot more. Read, learn and share to empower the sector.

B2B eCommerce Trends

ecommerce marketplace trend for middle east

Ecommerce Marketplace Trends in Middle East

Ecommerce Marketplace is growing all around the world by providing its unique selling platform. It gives multiple opportunities to vendors to sell their products along with providing variety of products, brands and comparative price options to customers.

When ecommerce is growing in all the sectors and across the globe, Omni channel ecommerce platforms consisting Ecommerce website, Ecommerce B2B and B2C app building, web apps etc. enabling the business owner to enhance business opportunity.

Few Important Statistics:

Both B2B and B2C Marketplace sectors are growing in Middle East at good place whereas market size of B2B would be higher by 234.78% than B2C.

With its exponential growth, the market is expected to reach $22 billion by 2020.

Leading Products and Services Marketplaces in Middle East –

  • Airline Ticket
  • Hotel and Tours
  • Event tickets
  • Electronics
  • Books and Magazines
  • Clothes and shoes

While the sectors is growing, grab the opportunity and go with the trend to grow up your business be it B2B or B2C. Specialist features also dedicated for particular industry will add on to the benefits.

This infographic will give you idea about B2B and B2C ecommerce marketplace in Middle East.

Ecommerce Marketplce trends

multi vendor marketplace infographic

Infographic – Importance of Multivendor Marketplace for Retail Industries

A lot of changes have occurred in the eCommerce industry since its origin. Ecommerce nowadays has taken a faster pace. Selling own products solely to offering products from multiple-sellers is a trend e-commerce/business owners are adopting. Online stores are taking a quick shift towards Marketplaces.

Reasons of E-commerce shift to Marketplace

    • In 2016, Amazon generated 22.99 billion U.S. dollars in third-party seller service revenues, up from 16.09 billion U.S. dollars in the previous year. Seller-service revenues account for the second-largest revenue segment of the online retail platform.
    • Customer Retention: In comparison to single ecommerce stores, a multi-vendor marketplace helps in retaining up to 89% of the customers.
    • Revenue Boost: Sales through Multivendor marketplaces will account to almost thrice as compared to online stores by 2021.
    • Huge Traffic: Multi-vendor stores helps in grabbing more traffic in comparison to single online store.
    • High Conversion Rates: Multi-vendor marketplaces offer a variety of products so that your customers need not look in to the other stores thereby increase in loyal customers and high conversion rates.
    • Earn High Commissions: More varieties, more offerings, more sales, therefore more commissions in your pockets.

Take a sneak peek to the Custom Writing’s Infographic below to know the Importance of Multi-vendor Marketplace for Retail Industries.

App infomania

Mobile App Infomania – Infographic

The entire world is wrapped around the Apps. Even small businesses have mobile apps to get better ROI and promote their businesses. There are various types of apps available in the market such as Native, Hybrid, and Web Apps. Today Mobiles have become a very important factor for the growth of any business. Where 19% customers prefer websites; 81% customers prefer a mobile app, in fact, 75% of revenue is generated through mobile apps. Mobiles are taking over desktops very quickly. Where there are 1800+ Million Mobile Users there are only 1600+ million Desktop users.

In 2016, 149.3 billion apps were downloaded, in 2017 197 billion apps and by 2021, it is expected that there will be 352.9 billion apps downloaded by the users. In Android, there are 2.8 Million apps available in the Play Store and 2.2 Million apps are available in the Apple App Store. In 2015 where revenue generated through apps was only $69.7 Billion, it is expected to reach $188.9 Billion by 2020.

Since the Mobile usage has increased the mobile app, payments have also skyrocketed. In 2015, it was $450 billion, in 2016, it was $680 Billion, in 2017, it is $780 Billion, and by 2019, it is expected to be $1080 billion. The satisfaction rate of Mobile Payment Apps is Apple Pay 66%, PayPal 45%, and Google Wallet 33%. All are fond of Apps, but do you even know the time & cost gone in developing an App? For a simple app, it takes 300 hours, moderate app 400-600 hours, and a highly multifaceted app 900+ hours. To build an Android App it will cost you between $10-$225 and to build an Apple App it will cost anywhere between $10-$250.

Having an app will not only ease your work but will help one fetch better ROI. It is less time consuming and helps you to business on the go. The stats prove that the customers prefer mobile app over websites.

Embed this Infographics

why-push-notification

Why Push Notifications must be part of your integral mobile commerce development and marketing plan?

Push Notifications are one major way to get customers occupied on your apps at regular intervals. They have proved it also with numbers. Thousands of infographics and statistics mention that push notification open rates range between 47-80%. These open rates lead to customer engagement and finally to sales. Still, there are some brands who are yet to recognize power behind these small messages.

So, here’s a sum up of ABC of push notifications, their reaction rates across different industry verticals and what tips one should keep in mind while opting for push notifications strategy. Have a look below

Embed this Infographics

Copy and paste the code below into your site.

mobicommerce-mobile-subscription-2015-2021

The State of Mobile Subscriptions and Subscribers from Q3 2015 to 2021 [Infographic]

The world is going mobile and there’s no doubt that this technology is one of the fastest adopted technologies worldwide. Reasons are being varying across the geographies for its adoption, the numbers increasing on daily basis left everyone astonished.

According to Ericsson Mobility Report published in November 2015, mobile subscriptions will reach around 9.1 billion in 2021. This is more than the current number of mobile subscribers. The reason being inactive mobile subscriptions, two or more subscriptions for single subscribers as devices have increased such as tablets and Smartphone.

An increase in mobile subscription is more of a widespread trend in all regions of the world. The developing regions are witnessing more mobile subscription growth as markets are still not saturated. As every region is experiencing growth in mobile subscription, there’s no reason left for global and local firms to leave out mobile as the important business domain.

The Top 5 Countries experiencing the highest growth in mobile subscription are — the Indian Sub-continent, China, USA, Myanmar and Nigeria. Because of high population in India and China and improved state of education, technology, income, living standards, they are topping the chart when it comes to mobile subscriptions.

As the internet penetration has reached to its peak, the Smartphone subscriptions are seeing a tremendous rise. Estimates show that there will be more than 3 billion rises in Smartphone subscriptions from 2015 to 2021.

Below is an infographic which throws more light on the current and future scenario of mobile phone subscriptions across different regions in the world.

Embed this Infographics

Copy and paste the code below into your site.

mCommerce Trends

Trending mCommerce Trend [Infographic]

We came across a recent study from CMO council regarding mobile commerce trend and the facts and figures shared. The mcommerce is expected to trend pretty well in the coming years. The number of smartphone users worldwide will surpass 2 billion in 2016, according to new figures from eMarketer. 33.7 million Shoppers prefer shopping over mobile application. In-app purchases will account for 64% of total smartphone app revenue in 2015. 61% of mobile shoppers fall in the age group of 18-35. 43% of shoppers use mobile phones directly from the phone. 46% of smartphone users have made a purchase through their mobile phone.

There are multiple things shoppers shop nowadays and here is what’s trending the most 19% of the total shoppers, shopped apparels, 17% food and beverage, 13% electronics, 11% home furnishing, 6% sports shopping, 5% jewelry, 12% other goods this gives a clear picture of what’s booming in the mobile shopping.

Figures say 78% of smartphone users access a retail site via a mobile app, while 32% of consumers used their smartphones to search better prices on consumer items, 63% of shoppers enjoy shopping over mobile apps, while 52% used their smartphones to search product reviews.

Some interesting facts are:

  • Mobile commerce will account for 24.4% of overall ecommerce revenues by the end of 2017
  • The majority of consumers are of the opinion that mobile-optimized sites run faster than non-mobile-optimized sites
  • Flurry’s most recent study shows 86% of mobile usage is within apps.
  • 64% of Small Businesses prefer having a fully functional mobile app for their online store shortly